Context and Background
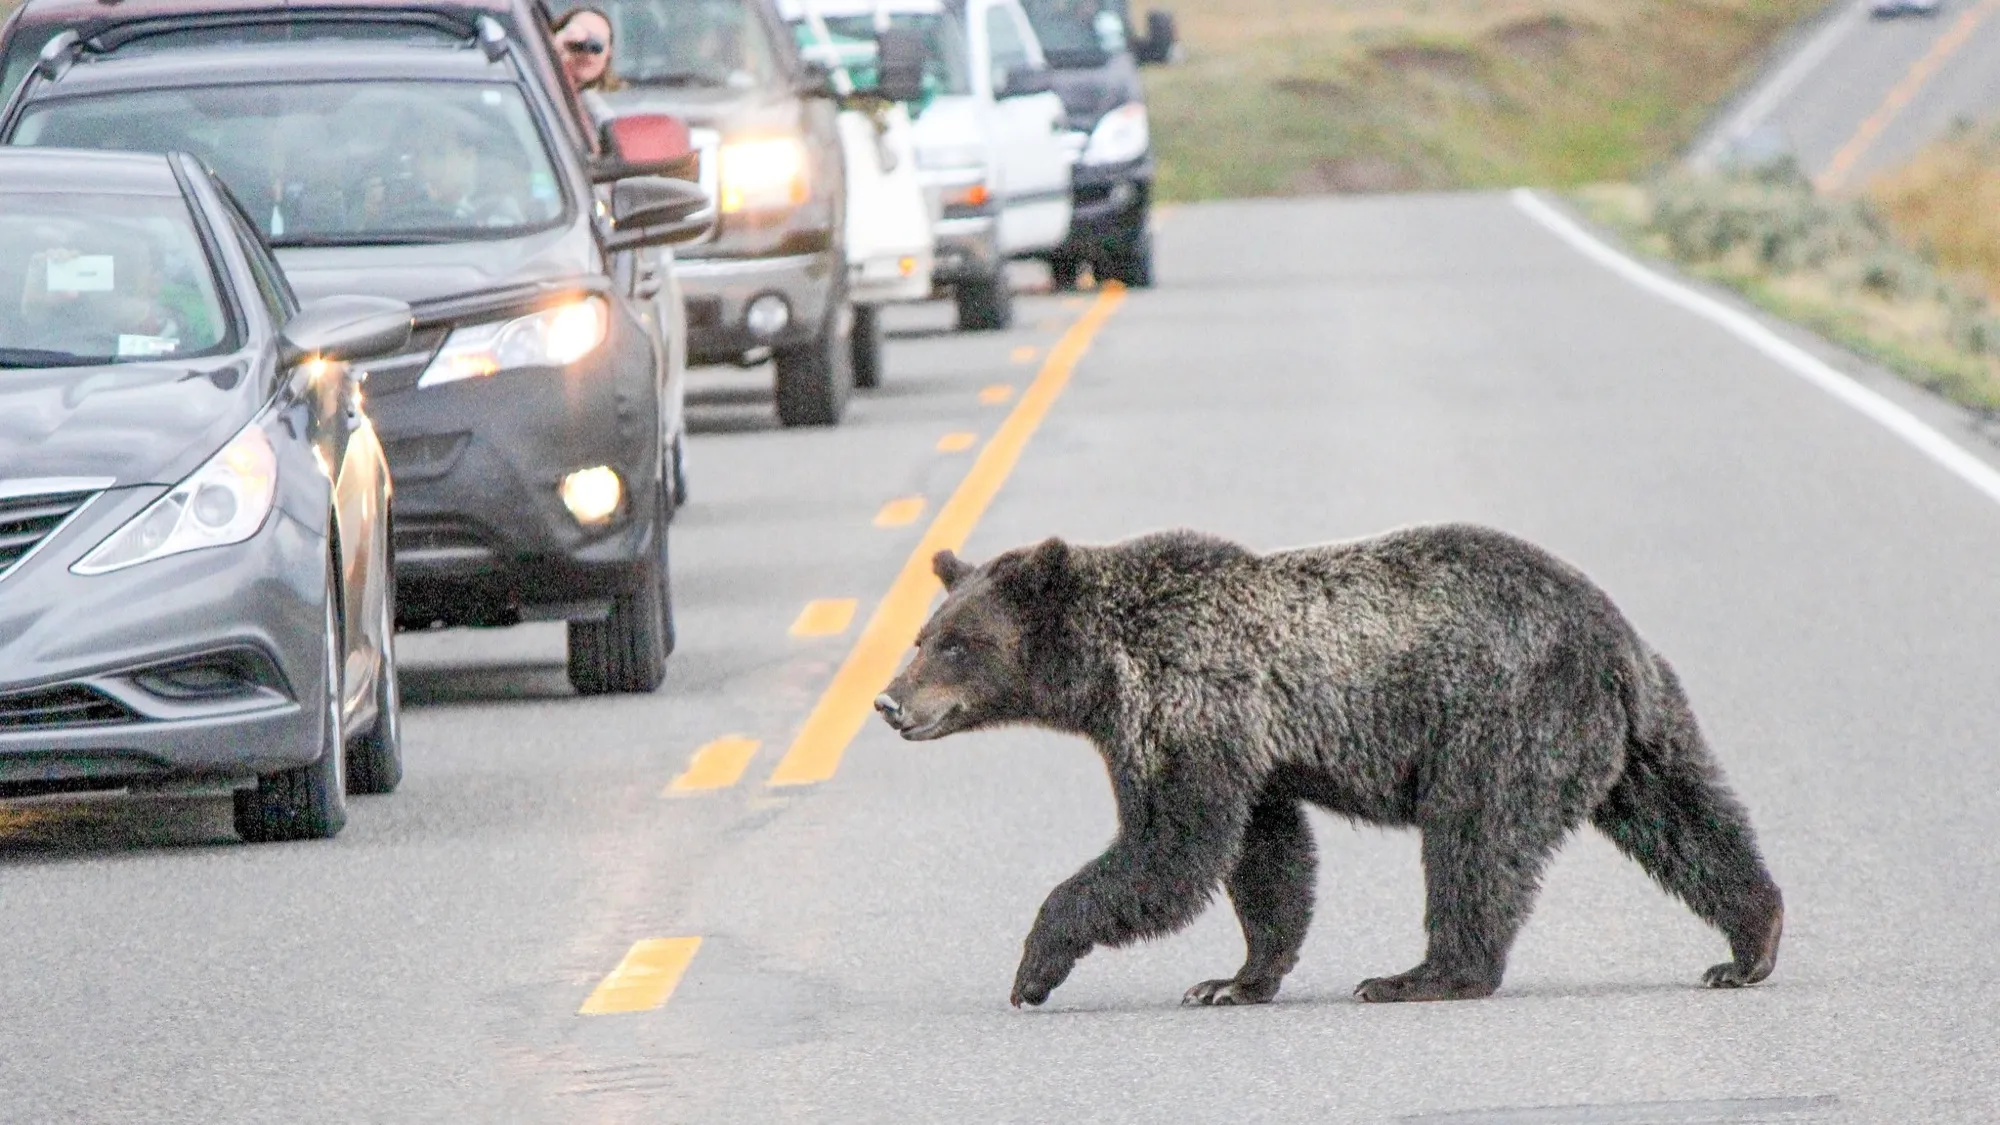
Vehicle collisions are one of the most documented threats posed to wildlife, being deemed a negative effect of roads. Consequently, this increases the risk of extinction by means of reduction in population size and genetic diversity. From an ecological standpoint, and on a broad scale, roadkill acts as an index of the health of the environment, showing fluctuations in the decline of species and degradation of habitat. For the grizzly bear Ursus arctos horribilis, being a large carnivore with a large home range, and a being a K-selected species, adequate road management is critical to its conservation.
The objective of this project was to use spatial analyses to evaluate how legally established protection boundaries intersect with linear infrastructures used by grizzly bears in western British Columbia, in Canada.
Vector-based methods were implemented to quantify exact distances between bears and roads, and to map spatial distribution of roads in relation to grizzly bear habitat.
Data Used
These are the datasets used for this project:
Aims and Methods
For this project, all coordinates were in NAD 1983 BC Environment Albers, and the objectives are broken down into three chapters.
Chapter 1
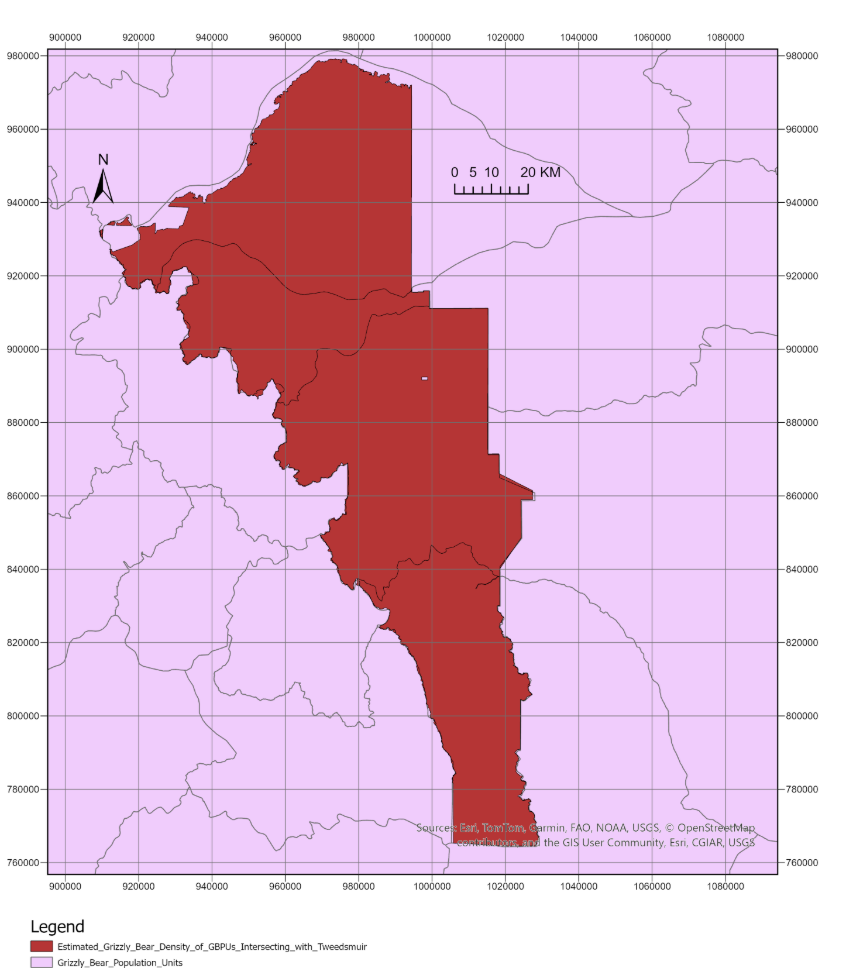
The main goal of this chapter was to quantify the mean density of grizzly bears per 1,000 km² among the grizzly bear population units intersecting the protected area of Tweedsmuir Provincial Park. According to the Cumulative Effects Framework (2023), any population subunit exceeding a density of 10 bears per 1,000 km² is deemed ecologically stable. Data from the BC Parks, Ecological Reserves, and Protected Areas, and the Grizzly Bear Population Estimates was acquired for this analysis.
The BC province wide provincial park polygon layer was filtered using the Definition Query such that only Tweedsmuir Provincial Park was displayed as a completely new polygon layer.
The population data was then clipped to Tweedsmuir using the Clip tool such that a new polygon layer with the attribute table displaying the population metrics inside this provincial park was created. Upon opening the attribute table, the Explore Statistics option was selected for the column displaying the bear densities to determine the mean.
Chapter 2
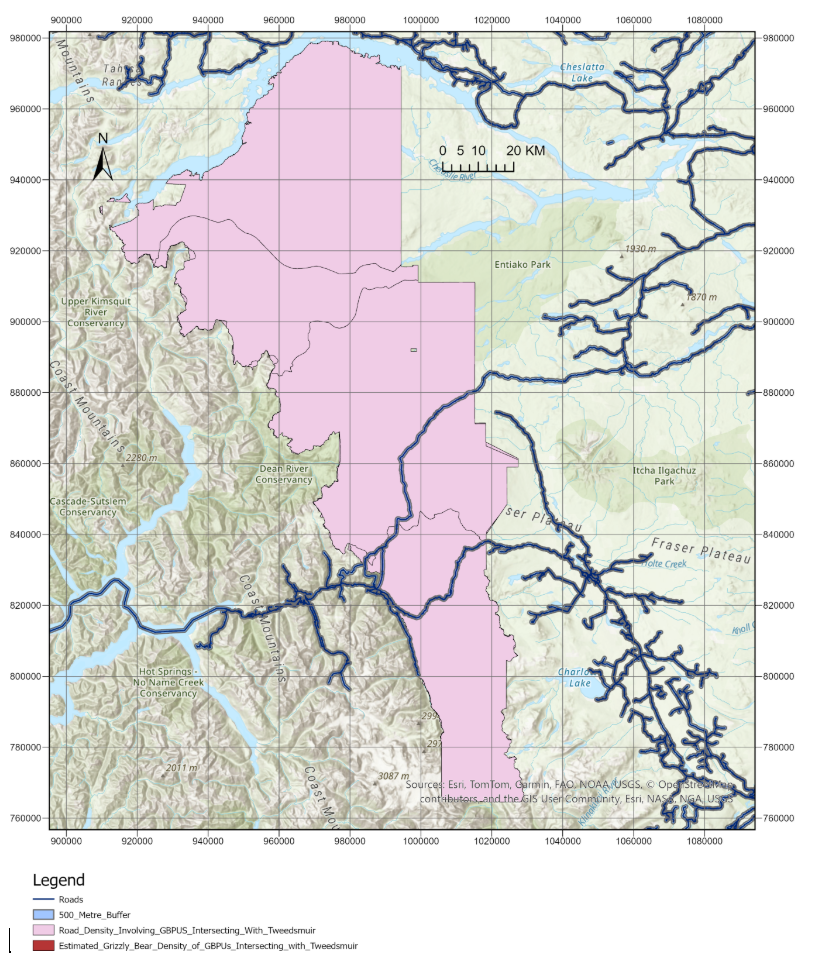
This chapter’s aim was to quantify the total density of roads in km per km² of all the GBPUs intersecting Tweedsmuir. According to the road density threshold established by Proctor et al. (2019), bears, particularly females with cubs in areas with road densities below 0.6 km/km² are considered to have a sustainable survival rate. The road line vector data was acquired from the Digital Road Atlas on the British Columbia Data Catalogue. Using the Summarize Within tool, generating a new layer. Subsequently, using the Calculate function upon opening the new layer’s Attribute table, road density for each of the 12 GBPU was calculated as total road length inside the polygons intersecting Tweedsmuir divided by their area. A summary of the resulting densities was soon provided.
Chapter 3
This chapter’s aim was to quantify the number of bear observations inside the GBPUs intersecting Tweedsmuir, their distance to a 500 m road buffer, and how many of those observations within these GBPUs overlapped both with foraging habitat whose primary vegetation composition was given suitability scores of 1 and 2 and the 500 m road buffer. This figure of 500 m with elevated risk of collision with vehicles and/or avoidance/aversion to crossing roads. The grizzly bear sightings, specifically chosen between March 25, 2022, and July 1, 2026, were acquired from iNaturalist, all of which were obtained through citizen science.
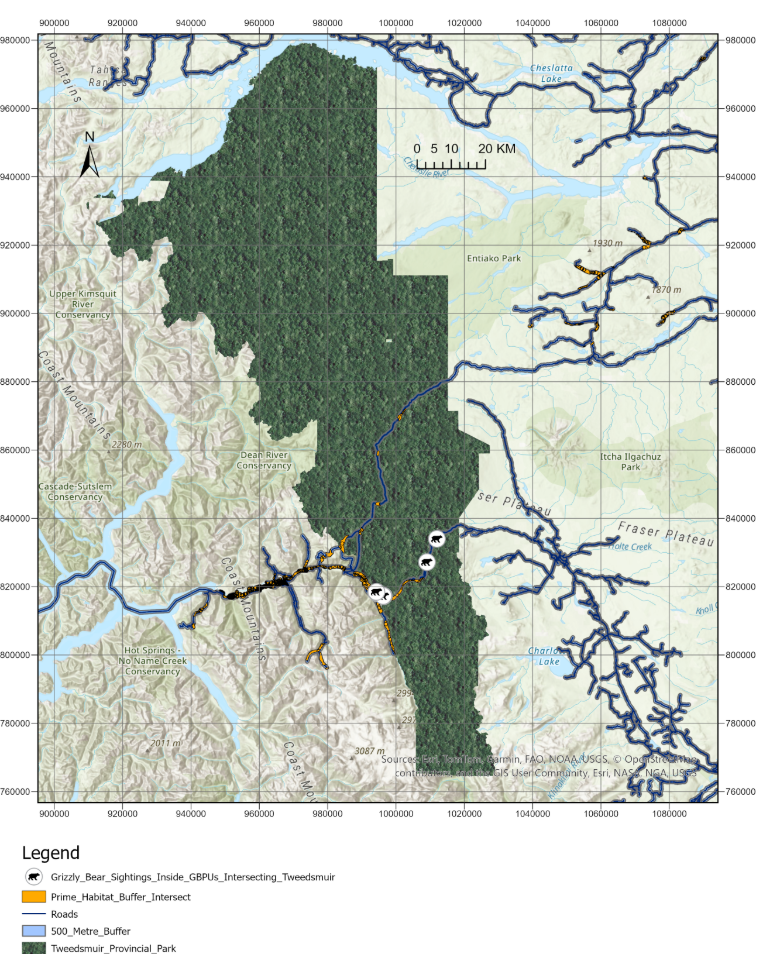
First, the Buffer tool was used, where the Input feature was chosen to be the BC road vector layer, with the threshold set at 500 m. The newly created layer featuring the 500 m buffer layer and the prime foraging habitat layer were incorporated into the Intersect tool, resulting in a layer displaying the overlap between prime grizzly bear foraging habitat and the 500 m buffer. Lastly, using the Select by Location tool, the iNaturalist grizzly bear sightings were isolated such that a layer displaying only those animals foraging in prime habitat within the 500 m buffer was created.
The next facet was quantifying the total proportion of prime habitat overlapping with the roads across the 12 GBPUs intersecting Tweedsmuir, and whether the distribution of grizzly bears was more concentrated towards the roads. This was acheived by using the Clip tool to only display the layers of the roads, buffers, prime habitats, and buffer habitat overlaps within the GBPUs intersecting Tweedsmuir. After that, the total area of the overlaps was divided by the total area of the prime habitats, from which, the percentage was found. After the proportion of overlaps within these 12 GBPUs was quantified, the index score of bears within the 500 m buffer was quantified, using the concept of Manley's selection ratio, where a value above 1.0 indicates active selection. The proportion of all buffers within the GBPUs intersecting Tweedsmuir was calculated by dividing their total area by that of the GBPUs intersecting Tweedsmuir.
Findings and Spatial Evidence
Chapter 1
The unweighted mean estimated grizzly bear population density across the GBPU areas that occurred within Tweedsmuir during the year 2018 was 17.97 individuals per 1,000 km². The lowest density across the GBPUs intersecting Tweedsmuir was 1.99 grizzly bears per 1,000 km². Other densities that fell below the threshold within the GBPU polygons intersecting Tweedsmuir were 4.45, 4.99, and 7.61 grizzly bears per 1,000 km². The highest density across these GBPUs intersecting Tweedsmuir was 47.82 bears per 1000 km².
Chapter 2
Upon opening the Attribute Table of the road density layer and clicking on the Explore Statistics option for the column displaying the calculated road densities within each polygon, it was found that the mean road density across the 12 GBPUs that intersected Tweedsmuir was 0.0046 km per km². The lowest road density across these GBPUs intersecting Tweedsmuir was 0.00009 km per km², and the highest density across these GBPUs intersecting was 0.0382 km per km².
Chapter 3
There was a total of 13 grizzly bears sighted inside Tweedsmuir, and all individuals were within the 500 m buffer. Individuals were as close as 0.2 m to the road, and as far as 408.4 m from the road.
There were 11 recorded observations occurring within the intersection of the road buffer and the prime foraging habitats whose primary vegetation composition was given scores 1 and 2. Thus, the proportion of bears within this buffer was 84.6%.
Calculations showed that the road buffer within the GBPUs intersecting Tweedsmuir spans a total of 223.2 km², while the area of Tweedsmuir sums up to 9877.7 km². This means that the buffer occupied approximately 2.3% of Tweedsmuir’s entire area.
There was a 9.0% overlap between the prime foraging habitats and the buffer within the GBPUs intersecting Tweedsmuir.
Using the figures of the 9.0% overlap and the proportion of bears caught within this buffer, the Manley Selection index yielded a value of 9.4.
Discussion and Next Steps
Although the GBPUs intersecting Tweedsmuir had a mean density of 17.97 grizzly bears per 1,000 km², which surpasses the threshold established by the Cumulative Effects Framework, four of those units had estimated densities below said threshold of 10 animals per 1,000 km². Despite the mean density not violating the threshold, this figure should not be deemed as the entire Tweedsmuir Park being ecologically stable, as this spatial analysis is based on a population unit level, and not provincial park level analysis.
The range of road densities inside Tweedsmuir, which was from 0.000087 to 0.038245 km per km², and the mean density of 0.004603 km per km² were substantially below the reference value 0.6 km per km². However, they are not robust enough to suggest the fact that grizzly bears possess a sustainable survival rate within Tweedsmuir, as traffic and road activity patterns also influence survival rates.
All 13 grizzly bear observations were recorded within 500 m of roads, and 11 of them were in areas that were classified as prime foraging habitat, which overlapped with the 500 m buffer established by Proctor et al (2019). However, uncertainty lies in whether their risk of collisions with vehicles was high, whether they foraged actively in ideal habitat, or whether the structure of roads impacted their distribution. Another limitation of this analysis is that the iNaturalist sightings based off citizen science may also display a bias for being skewed towards observations near roads, as opposed to remote backcountry. Another limitation of this study is that the datasets used are from different time periods. The GBPU population estimate data is from 2018, and the iNaturalist sightings chosen for this project are from the years 2022 to 2026. Therefore, this project’s results should be viewed as a spatial evaluation of readily available datasets, as opposed to using specific data occurring within the same time frame.
The closure of roads could be implemented in spring, when bears forage in close proximity to roads, including the decommissioning of roads when no longer necessary.
Also, it would be of use to monitor movements of collared animals and pair this data with slope and elevation models to evaluate how easily bears are able to cross roads.
Since iNaturalist sightings mainly come from motorists passing through the Highway 20, the next step would be deploying camera traps at distances with regular intervals away from roads and into the backcountry. That way, tracking bears as to where they move can happen without solely depending on citizen science data restricted to, and leaning heavily towards road proximity.
Core References Including Scientific Papers
- Boyce, M.S., Pitt, J., Northrup, J.M., Morehouse, A.T., Knopff, K.H., Cristescu, B. and Stenhouse, G.B. (2010). Temporal autocorrelation functions for movement rates from global positioning system radiotelemetry data. Philosophical Transactions of the Royal Society B: Biological Sciences, 365(1550), p.2213.
- Cumulative Effects Framework (2023). Ministry of Water, Land and Resource Stewardship and Ministry of Environment and Climate Change Strategy. [Online]. Available at: https://www2.gov.bc.ca/assets/gov/environment/natural-resource-stewardship/cumulative-effects/kootenay-boundary-region/cef-kootenay-grizzly-ccr-2023.pdf [Accessed: August 30, 2026].
- Northrup, J.M., Pitt, J., Muhly, T.B., Stenhouse, G.B., Musiani, M. and Boyce, M.S. (2012) Vehicle traffic shapes grizzly bear behaviour on a multiple‐use landscape. Journal of Applied Ecology, 49(5), pp.1159-1167.
- Proctor, M.F., McLellan, B.N., Stenhouse, G.B., Mowat, G., Lamb, C.T. and Boyce, M.S. (2019). Effects of roads and motorized human access on grizzly bear populations in British Columbia and Alberta, Canada. Ursus, (30e2), pp.16-39.